AutoMetrics: Approximate Human Judgments
with Automatically Generated Evaluators
ICLR 2026
Michael J. Ryan♠, Yanzhe Zhang♠, Amol Salunkhe♣, Yi Chu♣, Di Xu♣, Diyi Yang♠
♠Stanford University ♣American Express
Try AutoMetrics on your own data
Upload a small CSV of prompts, outputs, and human scores. We'll generate, select, and aggregate the metrics — no setup required.
Open the interactive demoWhat is AutoMetrics?
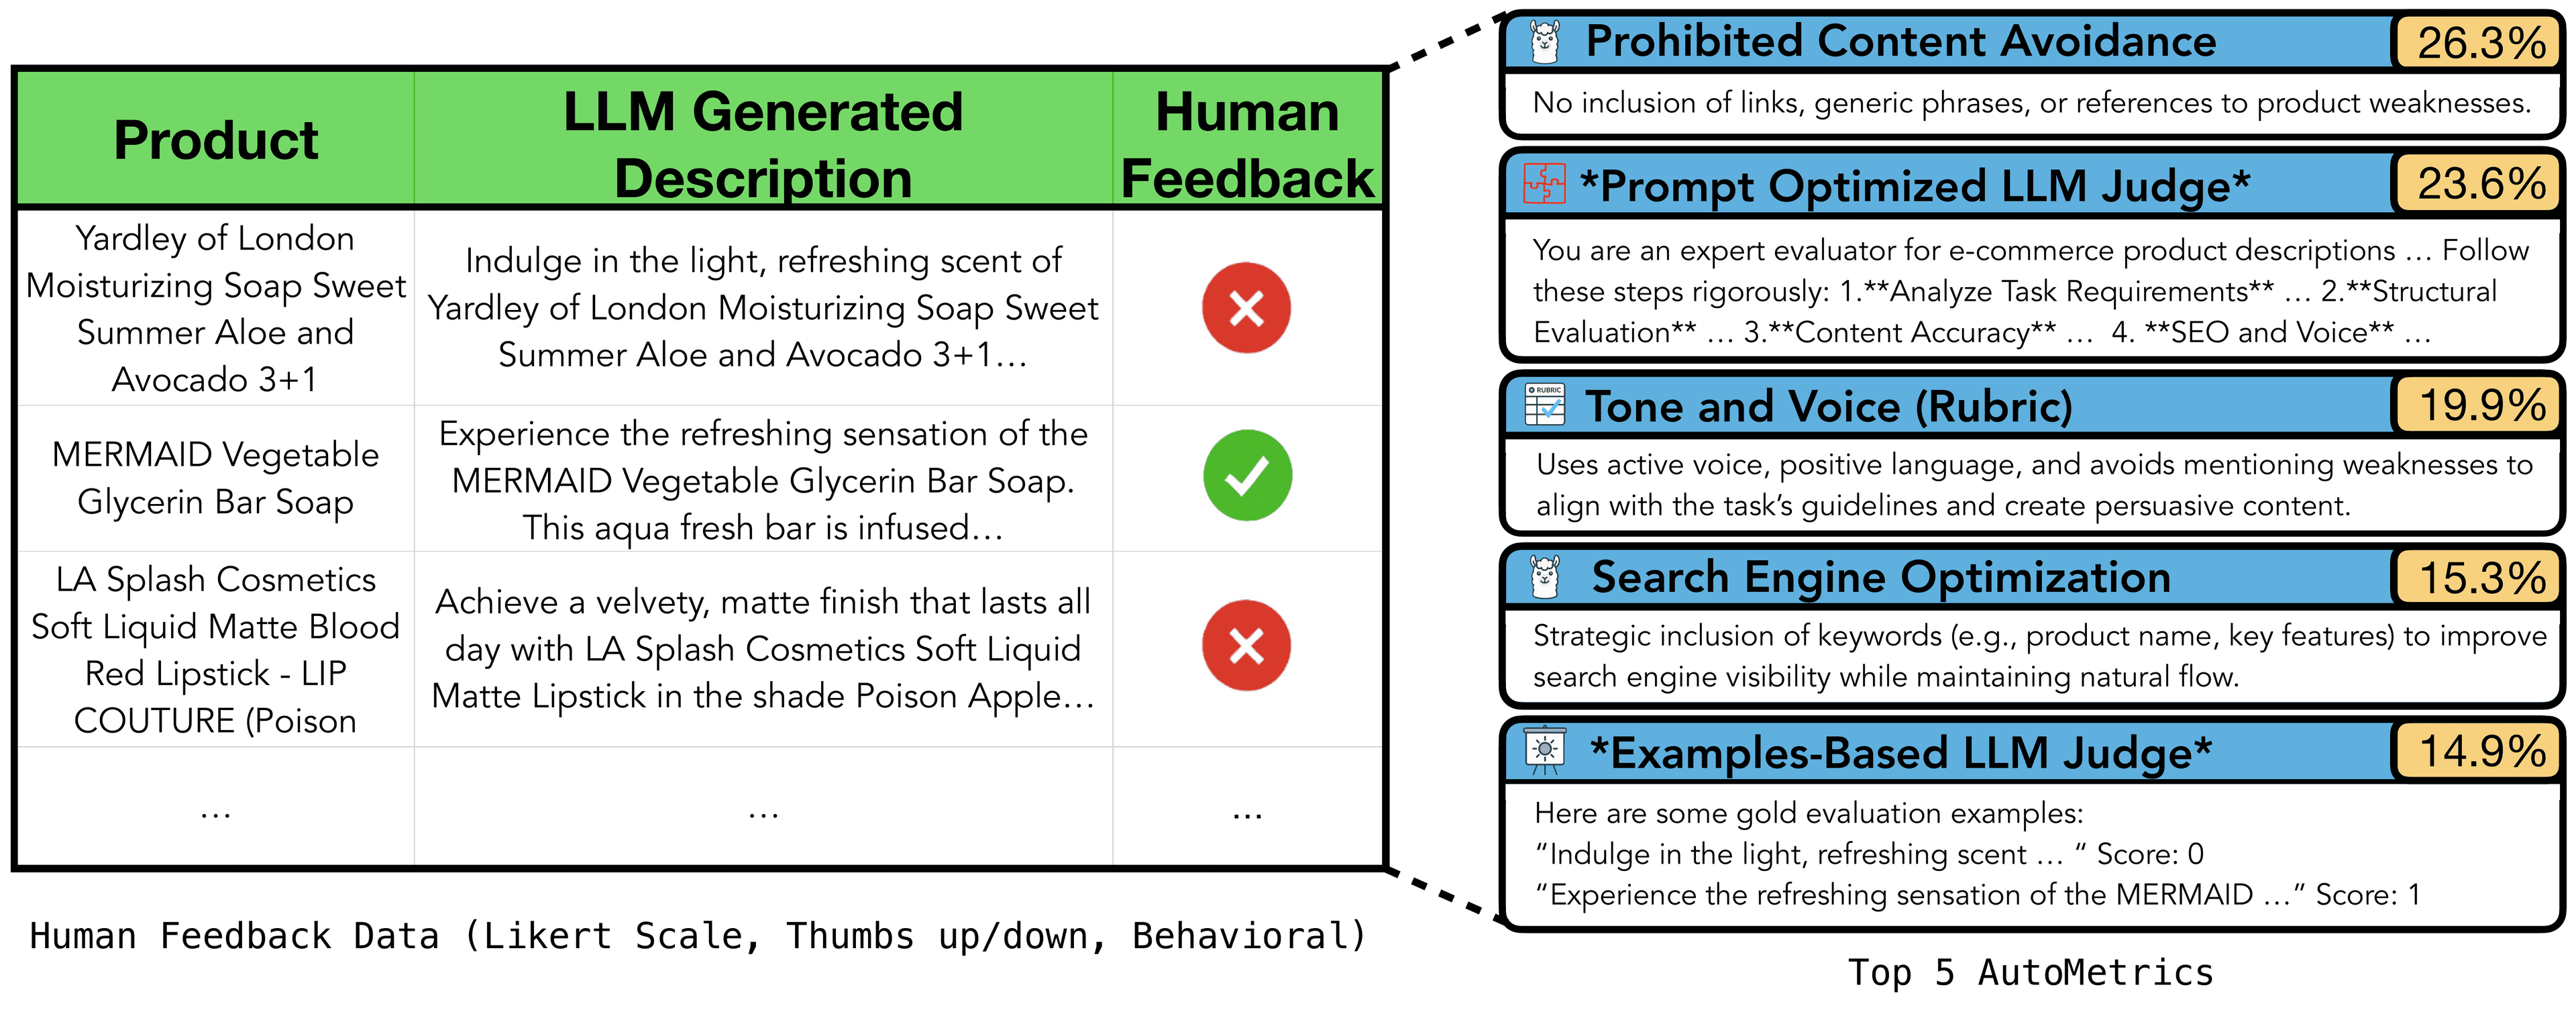
Human feedback is the gold standard for evaluating subjective AI — and the hardest thing to collect. Reward models want thousands of labels. Rubric LLM-judges want someone to write the rubric. A sprinkle of thumbs-up/down tells you nothing about what users actually value.
AutoMetrics meets you where you are. Hand it a task description and fewer than 100 feedback points. It proposes candidate criteria with LLM judges, pulls complementary metrics from a curated bank of 48, and fits a PLS regression against your labels. You get back an interpretable linear combination of named metrics — one that correlates with human ratings up to 33.4% better than LLM-as-a-Judge baselines and, in our τ-Bench case study, stands in for a verifiable reward during agent optimization.
Improvement over the closest LLM-as-a-Judge baseline on EvalGen — the largest out-of-distribution gain among the five evaluated tasks.
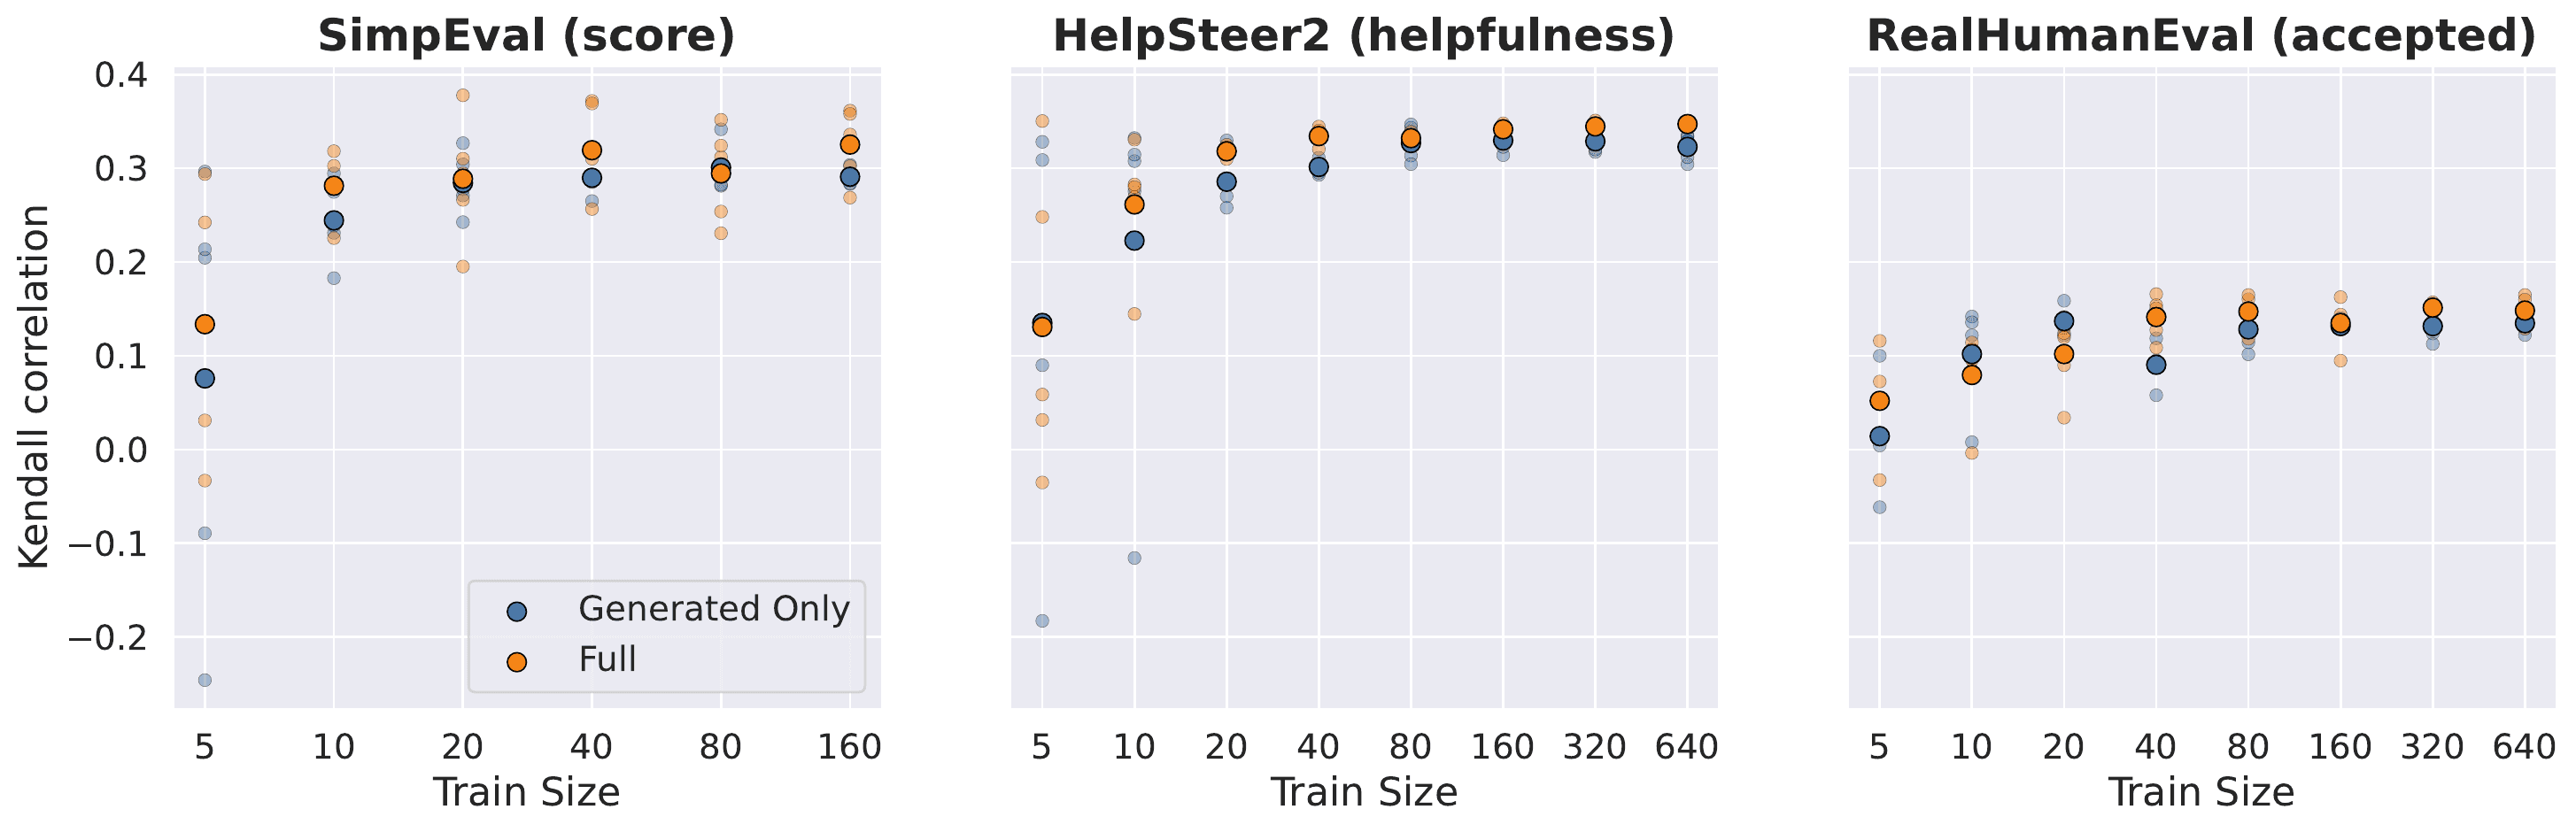
Across SimpEval, HelpSteer2, and RealHumanEval, correlation with human judgments plateaus around 80 training examples.
Used as an optimization signal for a ReAct agent, AutoMetrics matches the accuracy gains from optimizing on a verifiable reward (0.72 vs. 0.68 after 2000 rollouts).
The AutoMetrics Method
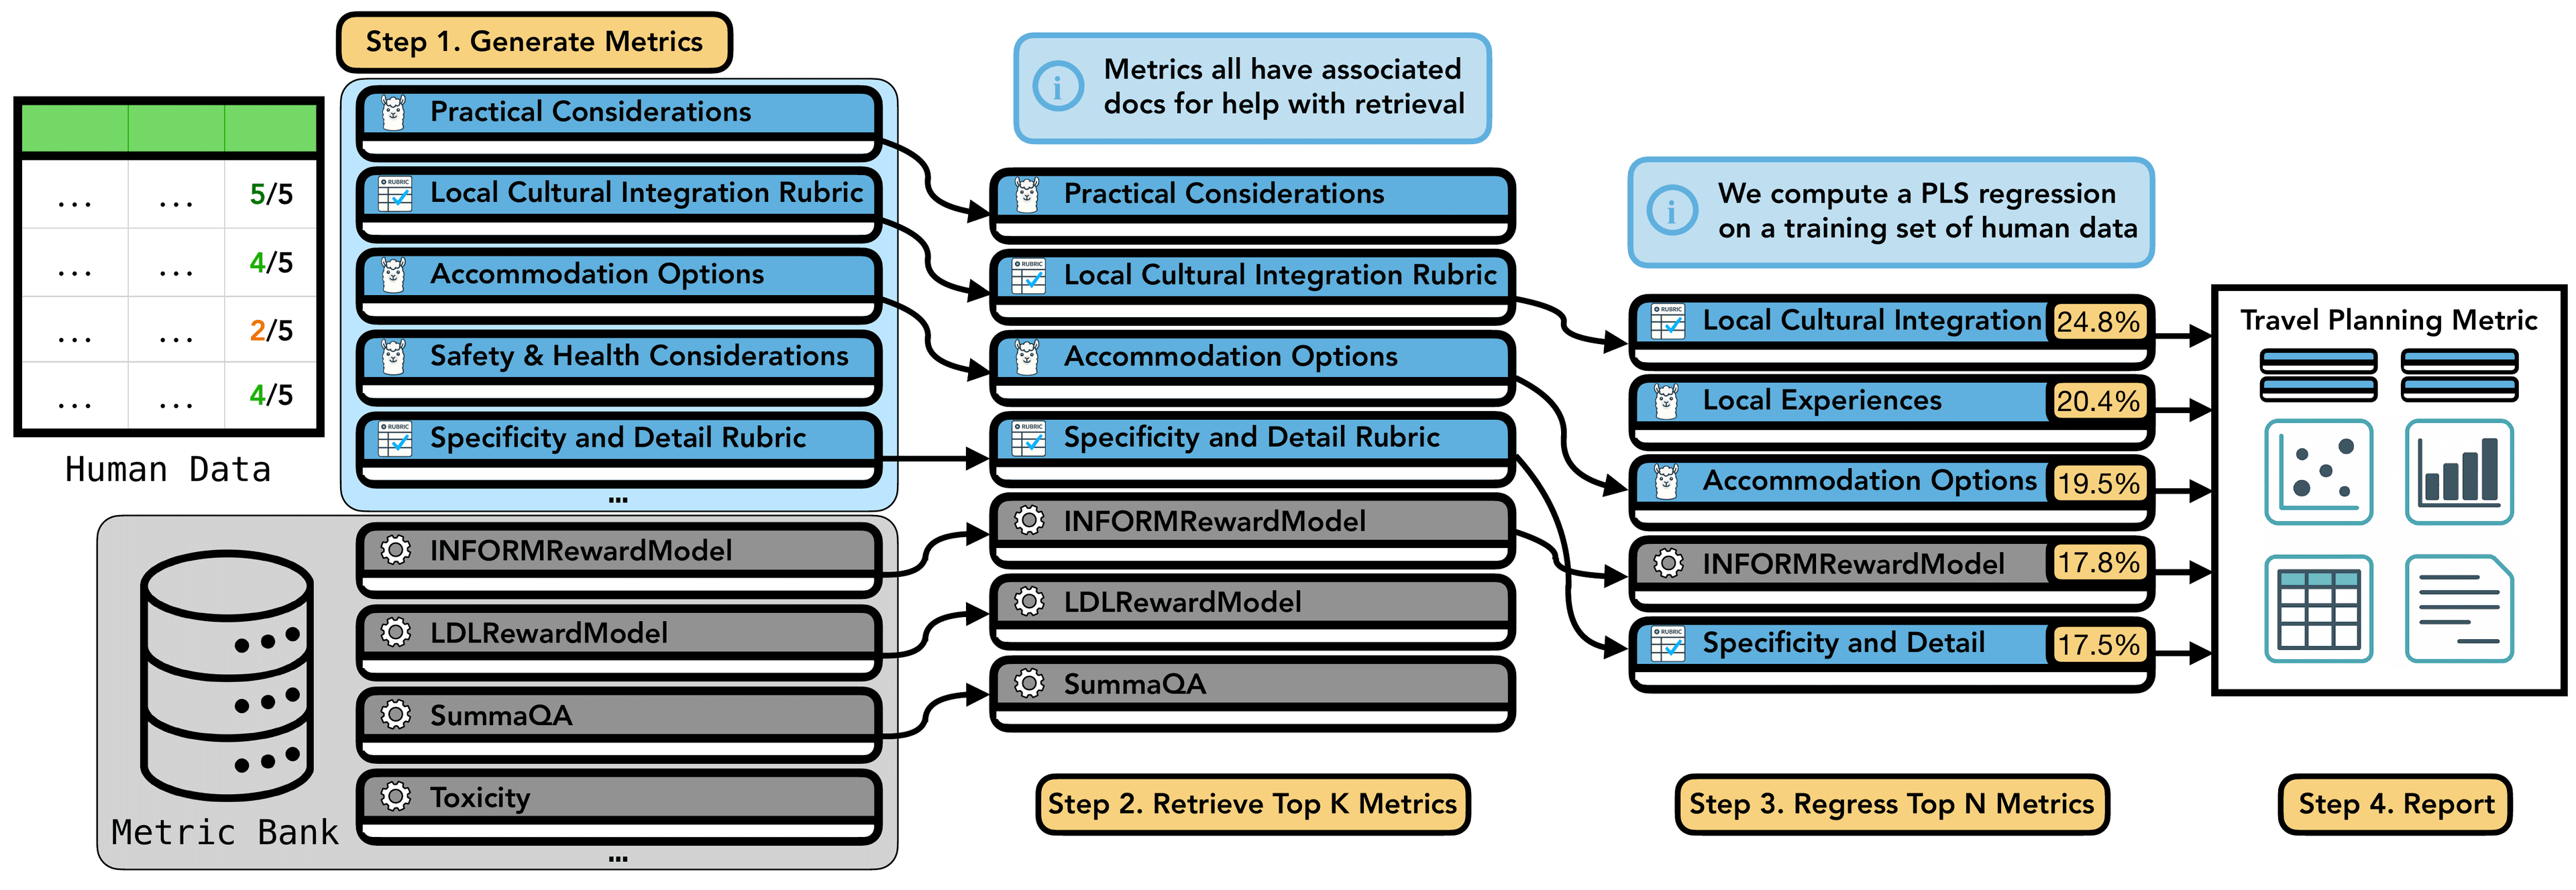
1. Generate
The default configuration produces 10 single-criterion, 5 rubric, 1 example-based, and 1 prompt-optimized LLM-as-a-Judge metric per run — validated across nearly 30 settings. Each generated metric ships with a Metric Card documenting description, intended use, implementation, and limitations.
2. Retrieve
Alongside generated metrics, AutoMetrics draws from MetricBank, a curated library of 48 metrics from the NLP literature, each with its own Metric Card. A hybrid ColBERT + LLM retriever uses the task description and target as the query and narrows down the candidate pool.
3. Regress
All metric scores are z-normalized and fit with Partial Least Squares regression. PLS handles the regime where predictors may outnumber observations and are correlated. A two-stage fit selects the top n metrics, then refits on that reduced set. Negatively correlated generated metrics are dropped (existing metrics are preserved — length can legitimately anti-correlate with conciseness).
4. Report
Every run emits (a) an aggregated metric as importable Python, (b) a Metric Card per generated metric, and (c) an interactive HTML Report Card with regression coefficients, correlation scatter, runtime distribution, per-example feedback, and p-value warnings when the selected metrics fail to reach statistical significance.
Results
Kendall's τ with 95% confidence intervals over 5 independent runs.
| Method | In-Distribution | Out-of-Distribution | |||
|---|---|---|---|---|---|
| SimpEval | HelpSteer2 | EvalGen | RealHumanEval | CoGym | |
| Model-agnostic | |||||
| Best Existing Metric | 0.246 ± 0.00 | 0.327 ± 0.00 | 0.193 ± 0.00 | 0.138 ± 0.00 | 0.074 ± 0.00 |
| MetaMetrics | 0.127 ± 0.01 | 0.204 ± 0.00 | −0.214 ± 0.01 | 0.025 ± 0.01 | −0.119 ± 0.02 |
| Finetuned LLM | 0.076 ± 0.08 | 0.039 ± 0.03 | 0.054 ± 0.05 | 0.049 ± 0.06 | 0.223 ± 0.20 |
| GPT-4o-mini backbone | |||||
| LLM-Judge | 0.272 ± 0.02 | 0.259 ± 0.01 | 0.161 ± 0.14 | 0.069 ± 0.01 | 0.199 ± 0.13 |
| DnA Eval | 0.234 ± 0.03 | 0.255 ± 0.02 | 0.174 ± 0.16 | 0.152 ± 0.01 | 0.185 ± 0.10 |
| AutoMetrics (ours) | 0.321 ± 0.04 | 0.324 ± 0.01 | 0.334 ± 0.06 | 0.160 ± 0.00 | −0.034 ± 0.17 |
| Qwen-3-32B backbone | |||||
| LLM-Judge | 0.294 ± 0.04 | 0.334 ± 0.02 | 0.272 ± 0.13 | 0.025 ± 0.01 | 0.276 ± 0.19 |
| DnA Eval | 0.042 ± 0.04 | 0.260 ± 0.02 | 0.232 ± 0.19 | 0.071 ± 0.15 | 0.353 ± 0.25 |
| AutoMetrics (ours) | 0.316 ± 0.02 | 0.342 ± 0.01 | 0.382 ± 0.05 | 0.145 ± 0.00 | 0.365 ± 0.08 |
AutoMetrics outperforms every baseline on all five tasks with Qwen-3-32B and is within the 95% confidence interval of the best method for 4 of 5 tasks with GPT-4o-mini. On EvalGen it improves Kendall correlation by 33.4% over the closest baseline (LLM-Judge).
Sensitive and stable
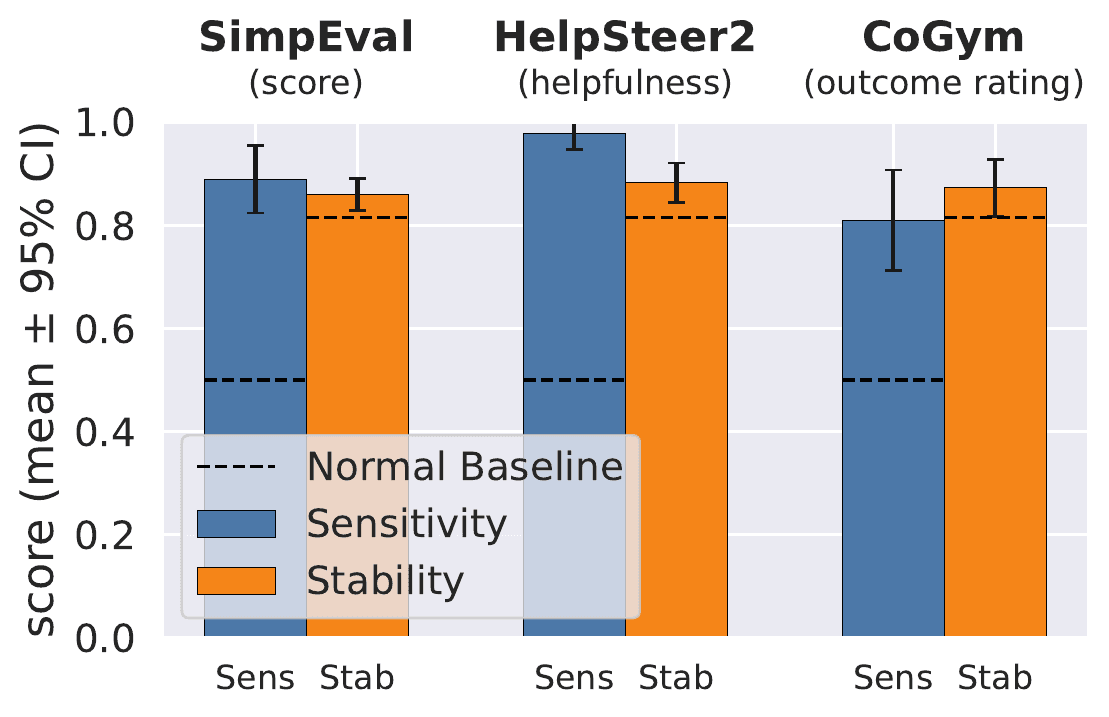
We operationalize construct validity through two measurements:
- Sensitivity: rate at which a metric assigns lower scores to degraded outputs.
- Stability: degree to which scores are preserved under quality-neutral perturbations.
AutoMetrics detects negative perturbations in 81.0–97.8% of cases across tasks (well above the 50% baseline) and remains stable under quality-preserving edits by more than a 95% confidence interval.
~80 examples saturate performance
We vary the training-set size from 5 up to 640 examples on three datasets and plot correlation on the full test set.
Performance levels off after about 80 samples across datasets and settings. At very low sample counts (10–20) on out-of-distribution tasks, Generated Only can outperform the full MetricBank — which is why AutoMetrics defaults to Generated Only below this threshold.
Case Study: Optimizing an Agent with AutoMetrics
AutoMetrics as a proxy reward for τ-Bench airline-assistance agent optimization.
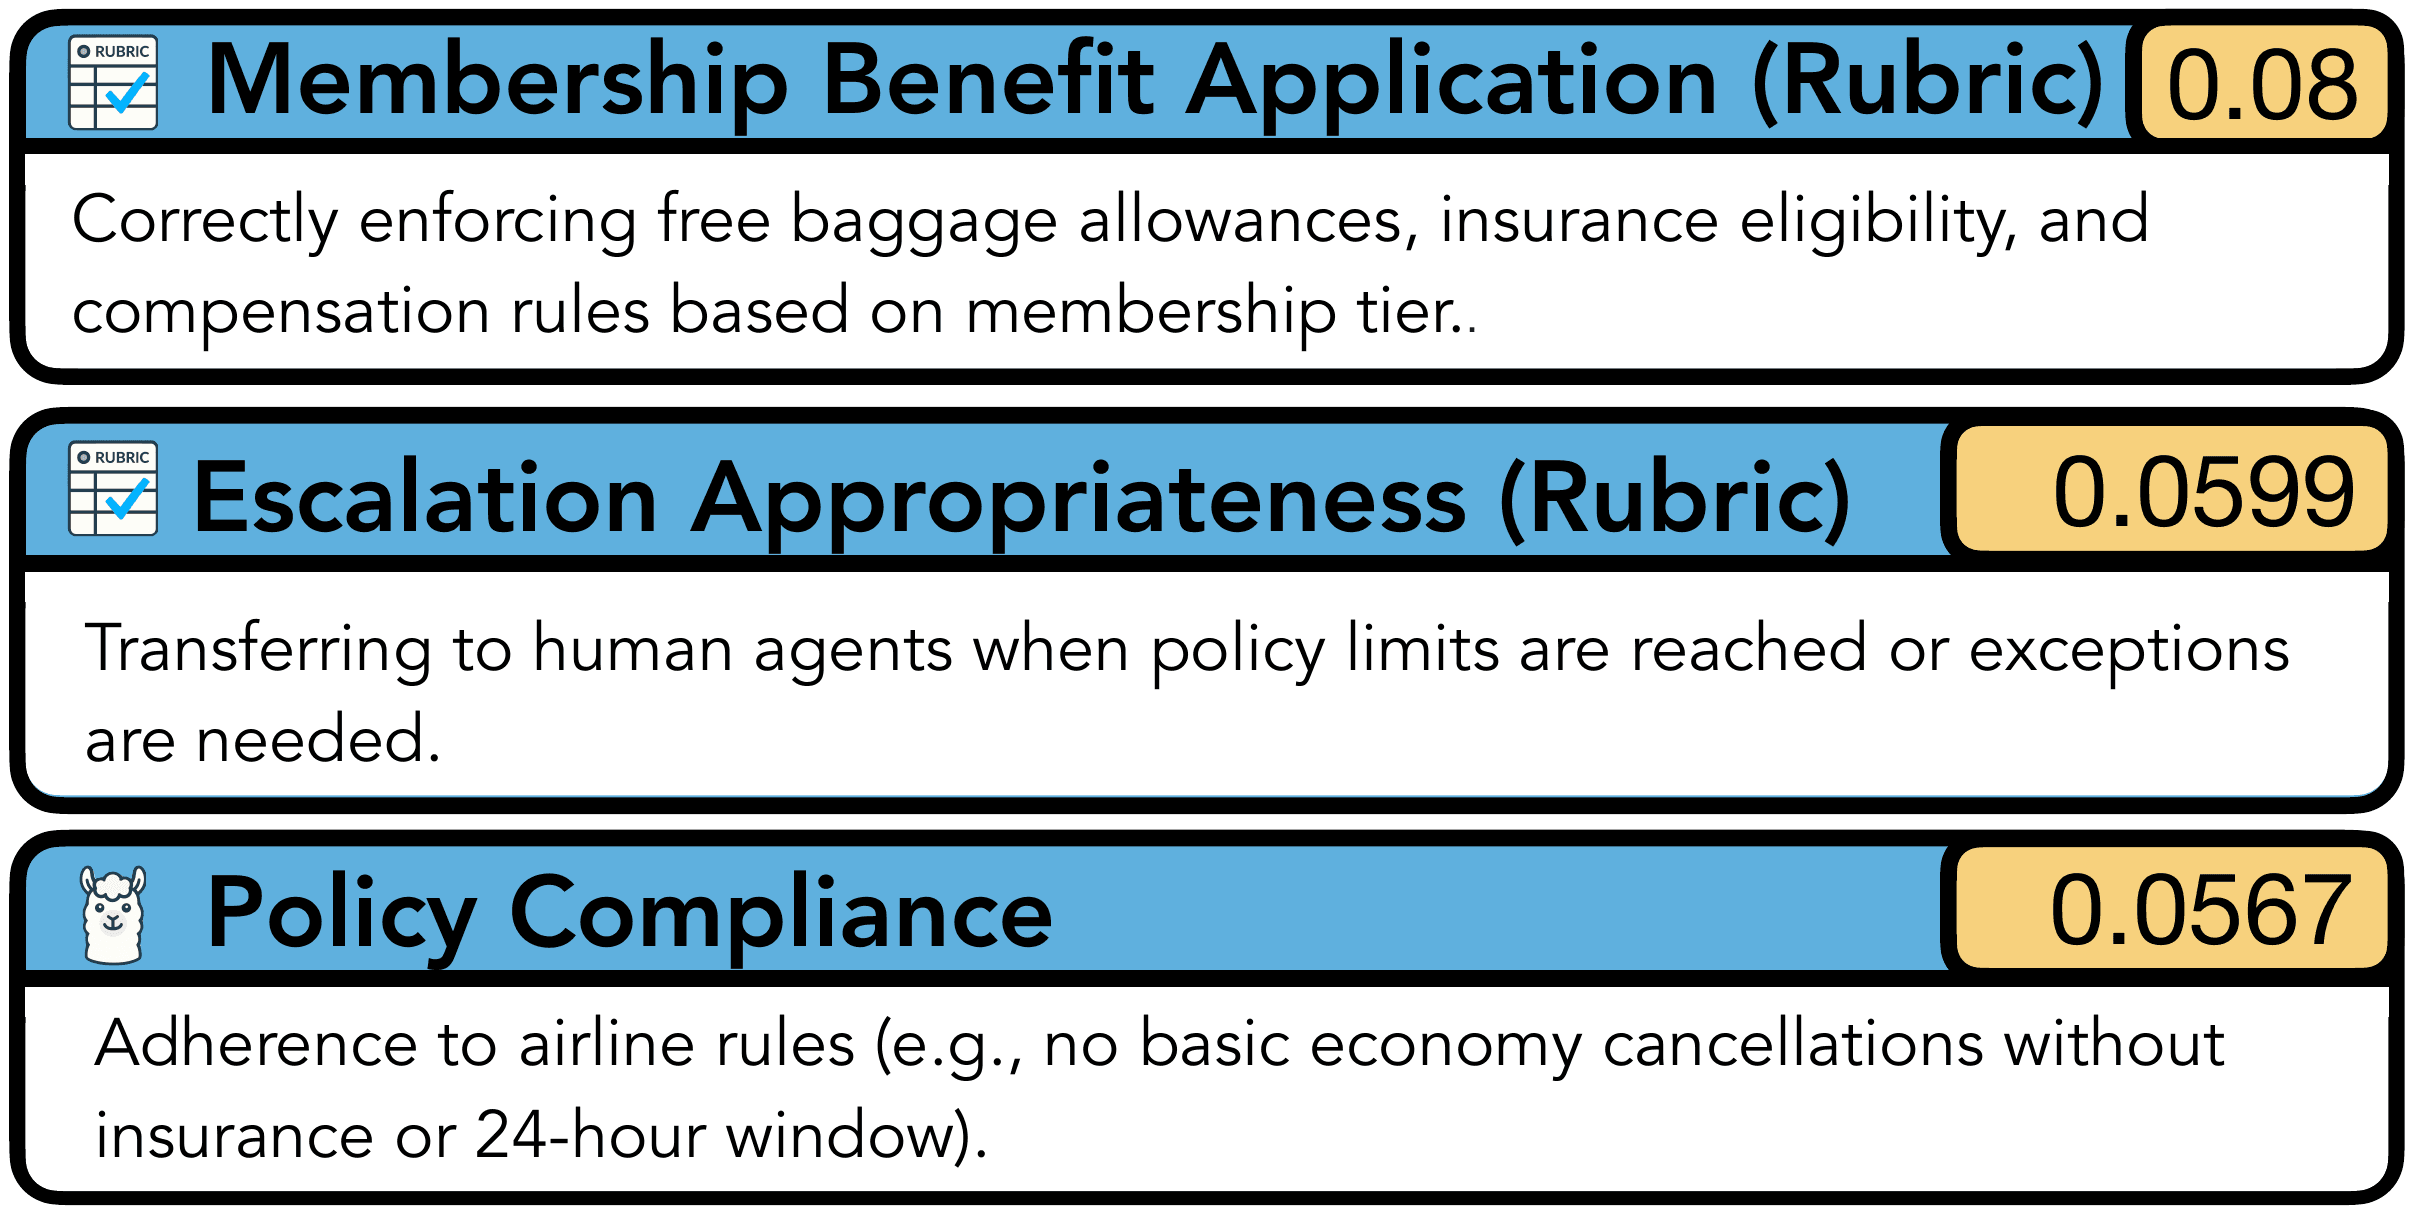
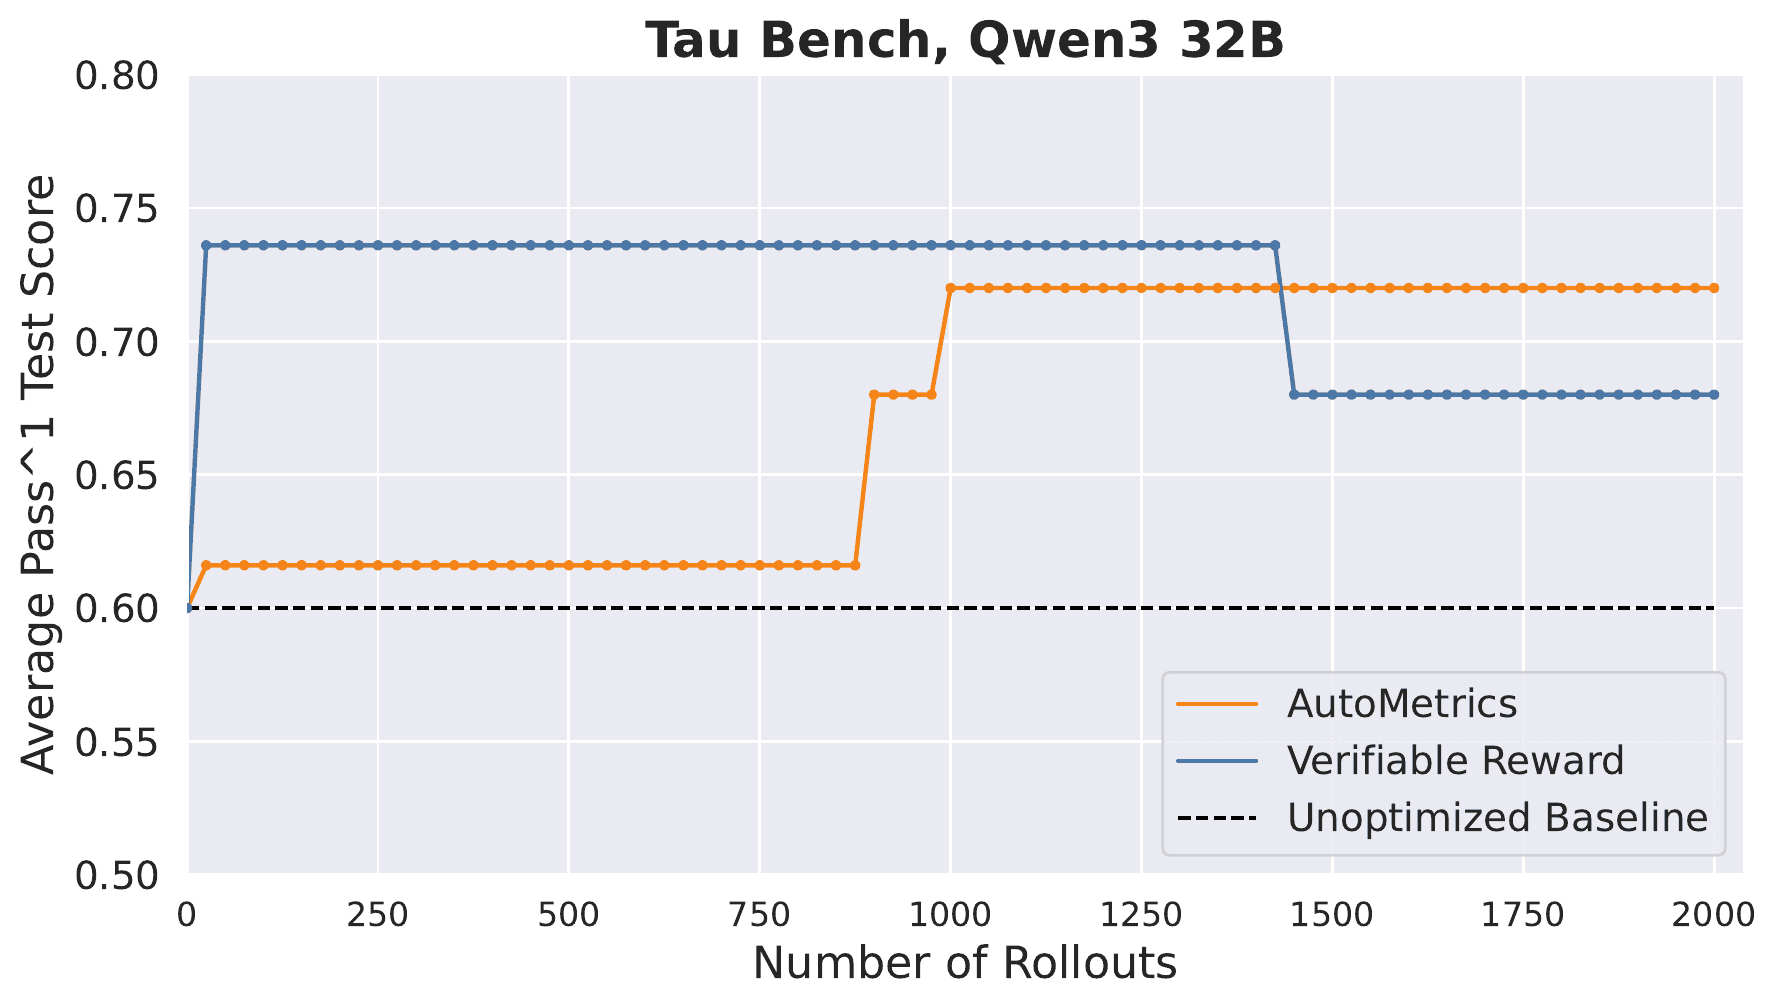
We split the 50 τ-airline tasks into 25 training and 25 evaluation. AutoMetrics runs in Generate Only mode and allocates extra budget for generation (10→20 LLM-judge metrics; 5→8 rubric metrics). The final filtering step removes two metrics for having negative coefficients, leaving three. Using those three as the optimization signal for a DSPy + GEPA ReAct agent yields accuracy that statistically significantly exceeds the unoptimized baseline (p < 0.05) and matches the gain from optimizing against a verifiable reward.
BibTeX
@inproceedings{ryan2026autometrics,
  title   = {AutoMetrics: Approximate Human Judgments with Automatically Generated Evaluators},
  author  = {Ryan, Michael J and Zhang, Yanzhe and Salunkhe, Amol and Chu, Yi and Xu, Di and Yang, Diyi},
  booktitle = {The Fourteenth International Conference on Learning Representations},
  year    = {2026},
  url     = {https://openreview.net/forum?id=ymJuBifPUy}
}